> ## Documentation Index
> Fetch the complete documentation index at: https://docs.salad.com/llms.txt
> Use this file to discover all available pages before exploring further.
# Service Performance and Reliability Overview
> To develop high-performance, reliable applications on SaladCloud
*Last Updated: May 20, 2026*
SaladCloud consists of tens of thousands of globally distributed nodes, primarily high-performance desktop computers and
servers running the SaladCloud agent. Each node is equipped with consumer-grade GPUs, along with varying CPU and memory
configurations. Node distribution is uneven across regions and countries: nodes in the US and Canada account for 50–60%
of the total.
When these devices are idle, SaladCloud leverages them to run workloads by dynamically pulling and executing container
images. Once a container group is stopped, the image and any associated runtime data are removed from the allocated
nodes, which are then released.
Due to its distributed architecture, nodes can vary in distance, latency, network throughput to specific endpoints,
startup times, uptimes, and processing capabilities—factors that should be carefully considered when designing
applications on SaladCloud.
## Startup Times
When a container group starts, its image is first pulled from your registry into SaladCloud’s internal caches in Europe
and the US (only once), and then distributed to the allocated nodes.
Startup times can range from a few minutes to longer, depending on image size and network conditions. Instances on nodes
located closer to a cache or with higher throughput typically come online faster. You can further improve startup speed
by using smaller images to reduce transfer and decompression time, and by deploying workloads in regions closer to the
EU or US.
[Our 2025 test](https://github.com/SaladTechnologies/performance-reliability-test-2025/) measured the startup times for
100 container instances at high-priority across all consumer GPU types and regions, using a 5.53 GB image. This metric
tracks the number of instances that became operational since startup:
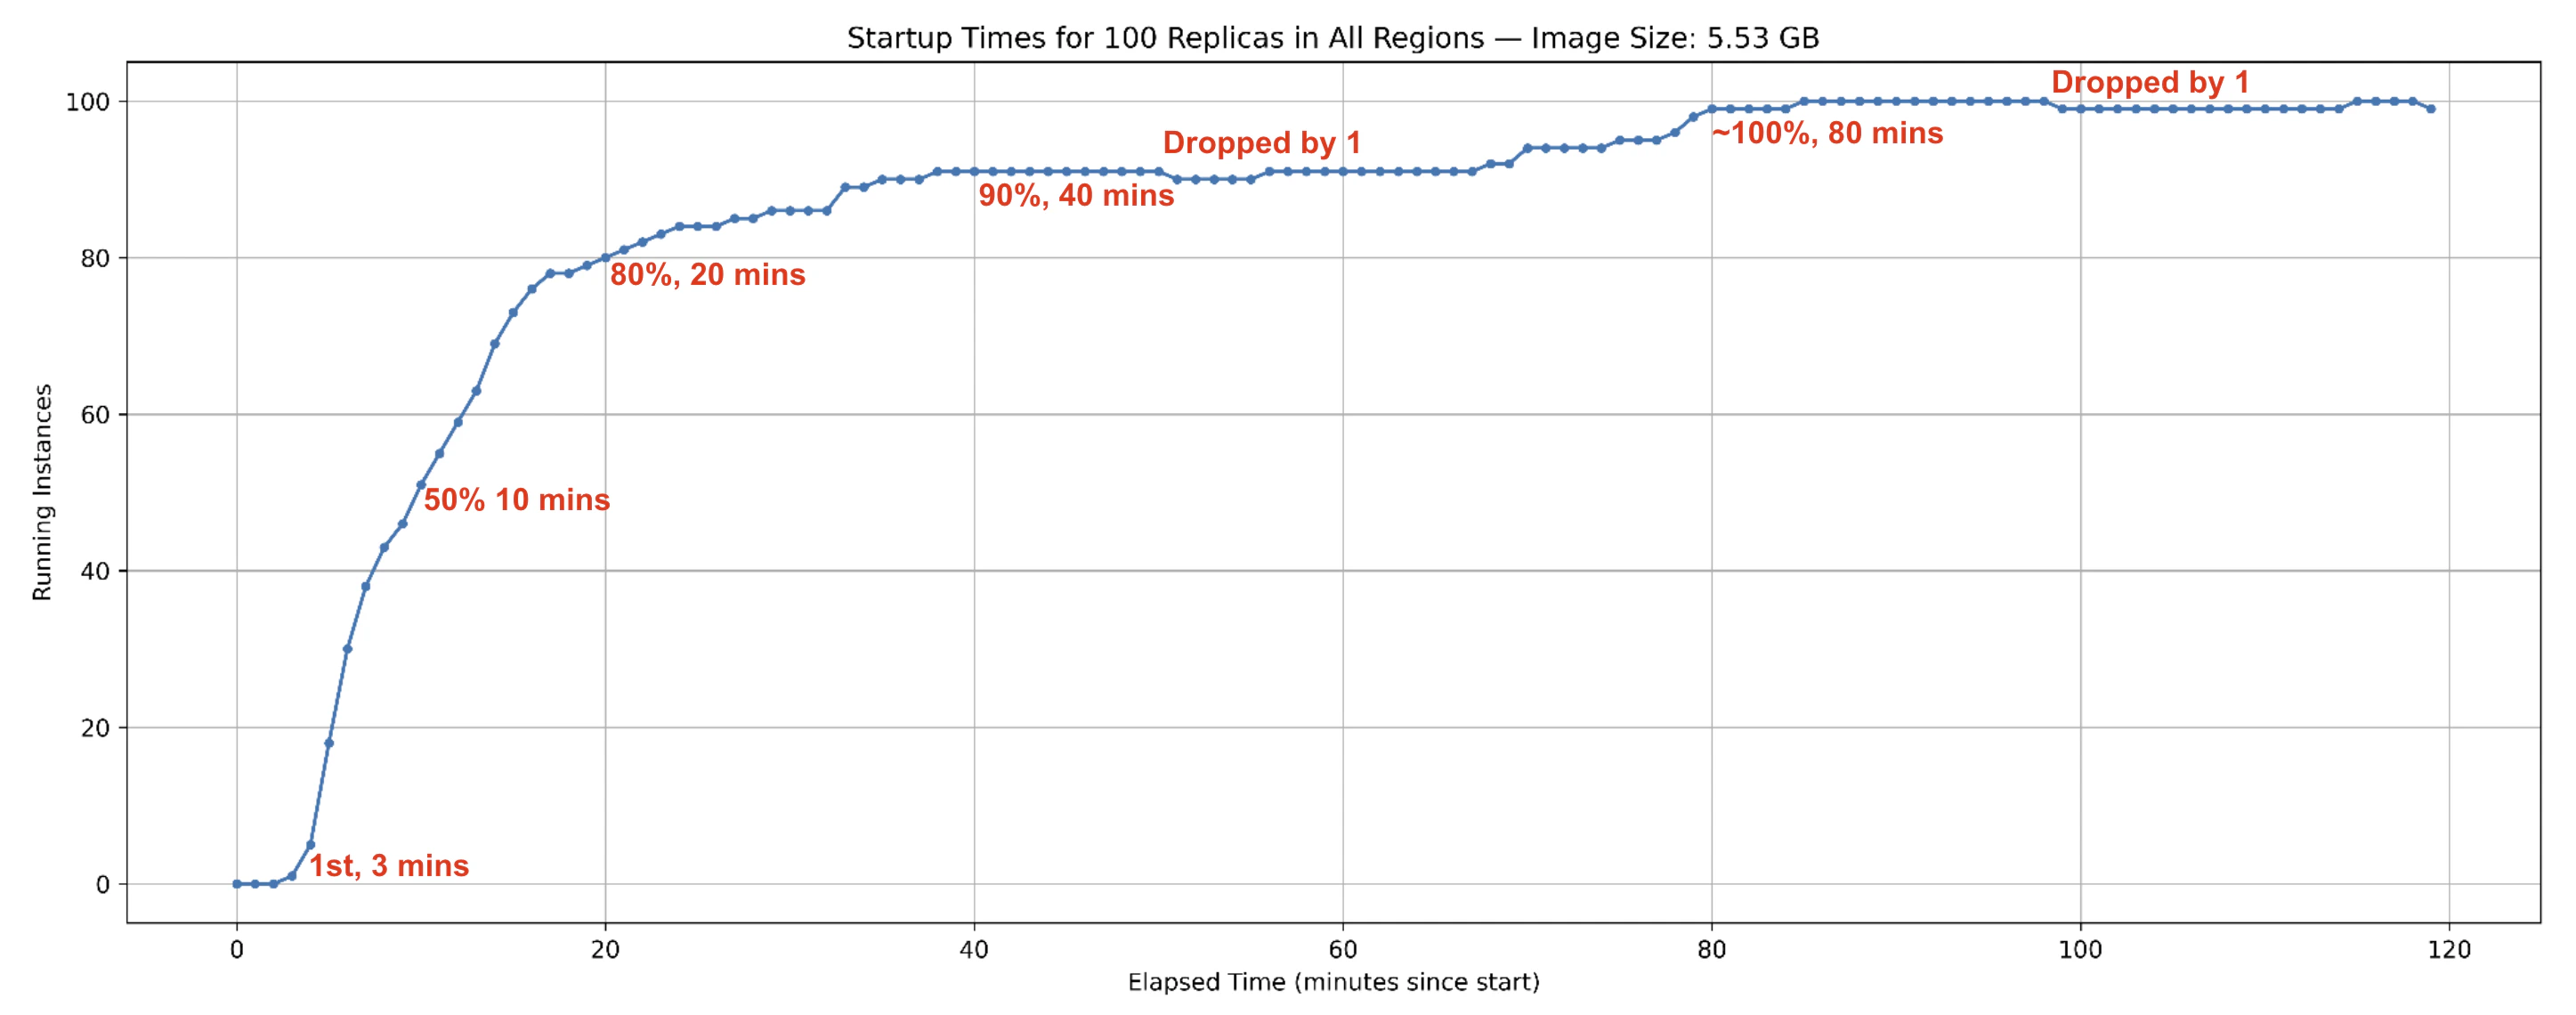 Key observations are:
* Instances began coming online and reporting results within `3 minutes` of the test start.
* `50% of instances` came online by `10 minutes`, `80%` by `20 minutes` and `90%` by `40 minutes`.
* The count of online instances then briefly dropped by one, indicating one instance was just reallocated.
* By around `80 minutes`, nearly all 100 instances were online, with minor fluctuations afterward due to reallocations.
## Interruptions and Reallocations
An instance may go offline after coming online for several reasons. In such cases, a new instance is allocated to
continue processing:
* **Voluntary Interruptions**: Node owners may temporarily reclaim their resources for their own use, pausing sharing.
However, high-priority workloads that run reliably over long periods generate higher earnings, giving owners less
incentive to interrupt.
* **External Interruptions**: Factors such as power outages, network issues, or hardware failures can also take nodes
offline.
* **Proactive Reallocations**: During periods of high demand, SaladCloud may reassign resources from lower-priority
workloads to higher-priority ones. Applications can also trigger reallocation via IMDS Reallocate API if current
instances fail to meet requirements.
The same 2025 test also tracked interruptions and reallocations for the 100 container instances over a 7-day period. To
avoid the effects of initial allocations, the first two hours after startup were excluded. The hourly and daily
reallocation results are shown below:
Key observations are:
* Instances began coming online and reporting results within `3 minutes` of the test start.
* `50% of instances` came online by `10 minutes`, `80%` by `20 minutes` and `90%` by `40 minutes`.
* The count of online instances then briefly dropped by one, indicating one instance was just reallocated.
* By around `80 minutes`, nearly all 100 instances were online, with minor fluctuations afterward due to reallocations.
## Interruptions and Reallocations
An instance may go offline after coming online for several reasons. In such cases, a new instance is allocated to
continue processing:
* **Voluntary Interruptions**: Node owners may temporarily reclaim their resources for their own use, pausing sharing.
However, high-priority workloads that run reliably over long periods generate higher earnings, giving owners less
incentive to interrupt.
* **External Interruptions**: Factors such as power outages, network issues, or hardware failures can also take nodes
offline.
* **Proactive Reallocations**: During periods of high demand, SaladCloud may reassign resources from lower-priority
workloads to higher-priority ones. Applications can also trigger reallocation via IMDS Reallocate API if current
instances fail to meet requirements.
The same 2025 test also tracked interruptions and reallocations for the 100 container instances over a 7-day period. To
avoid the effects of initial allocations, the first two hours after startup were excluded. The hourly and daily
reallocation results are shown below:
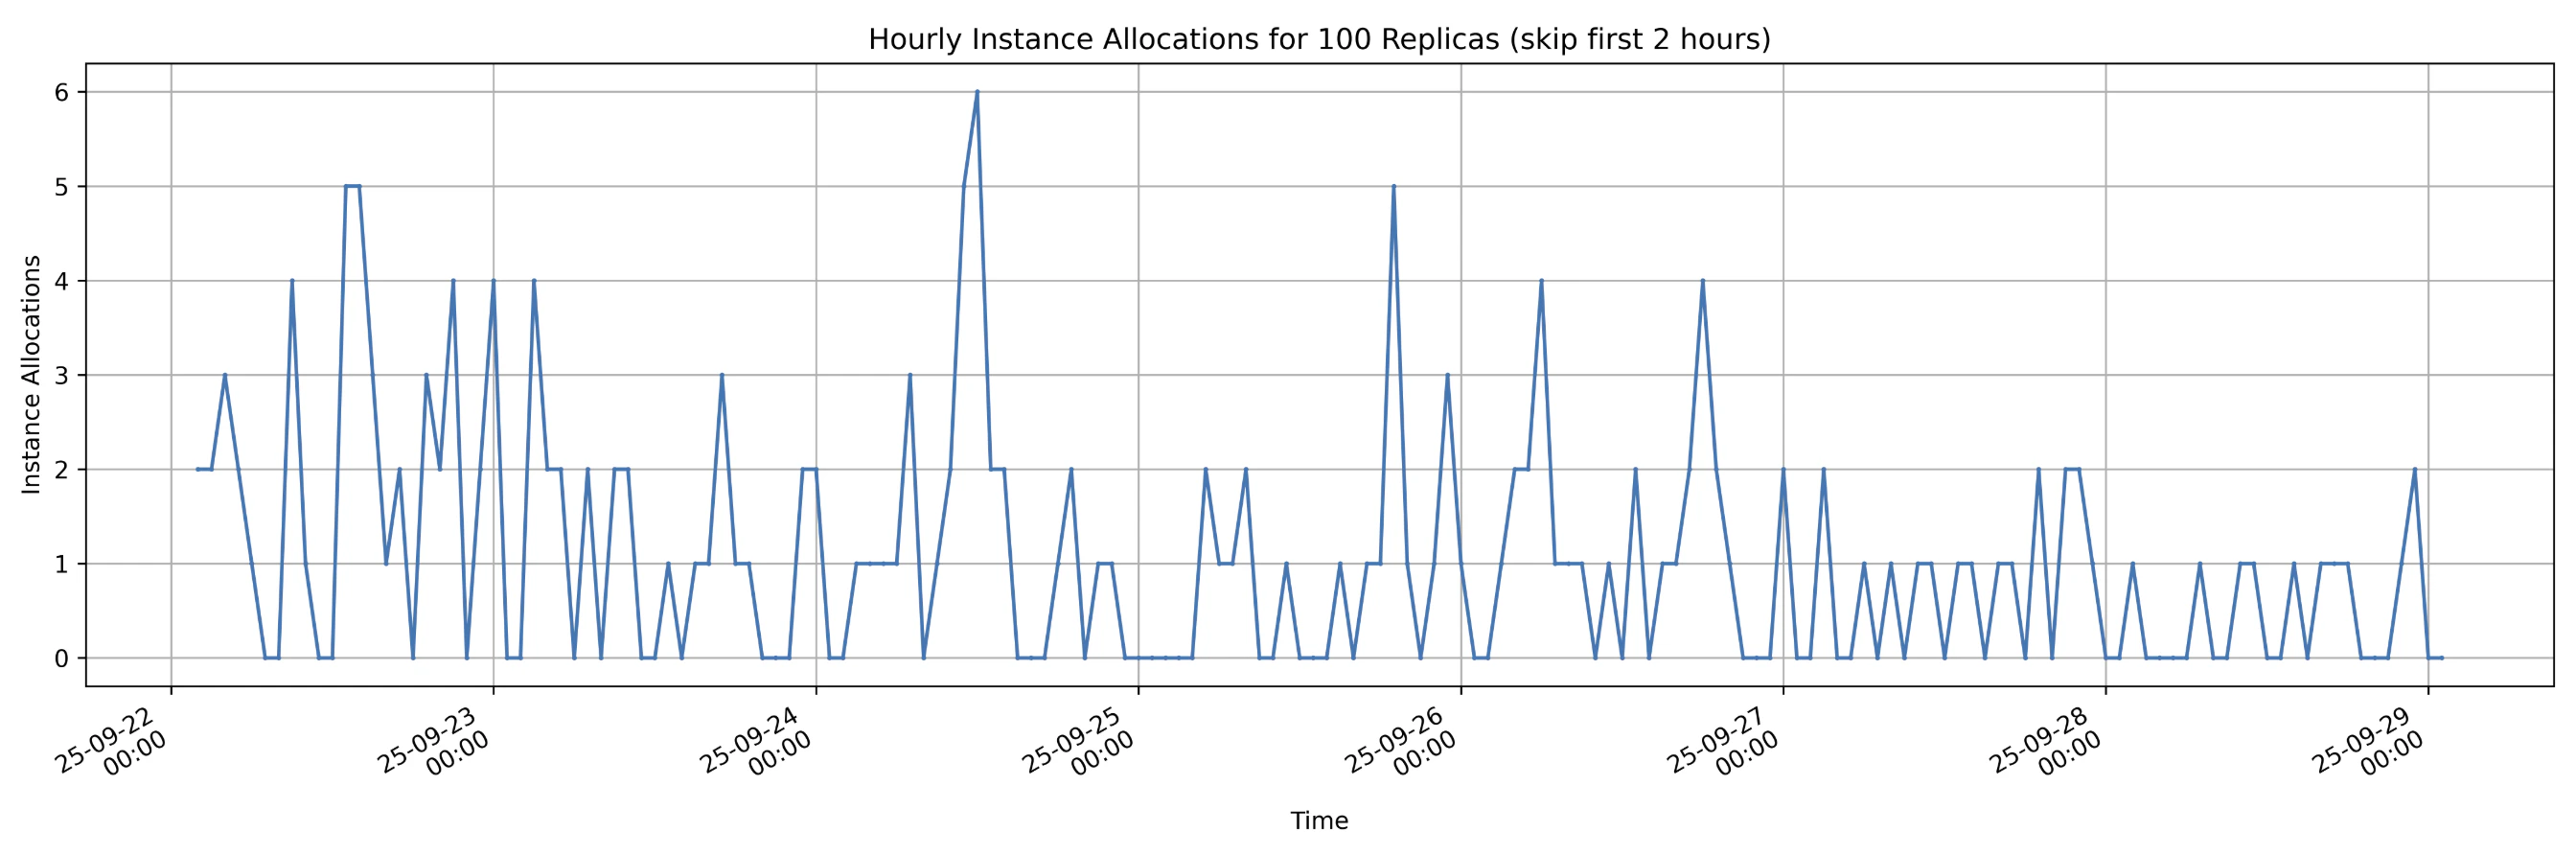
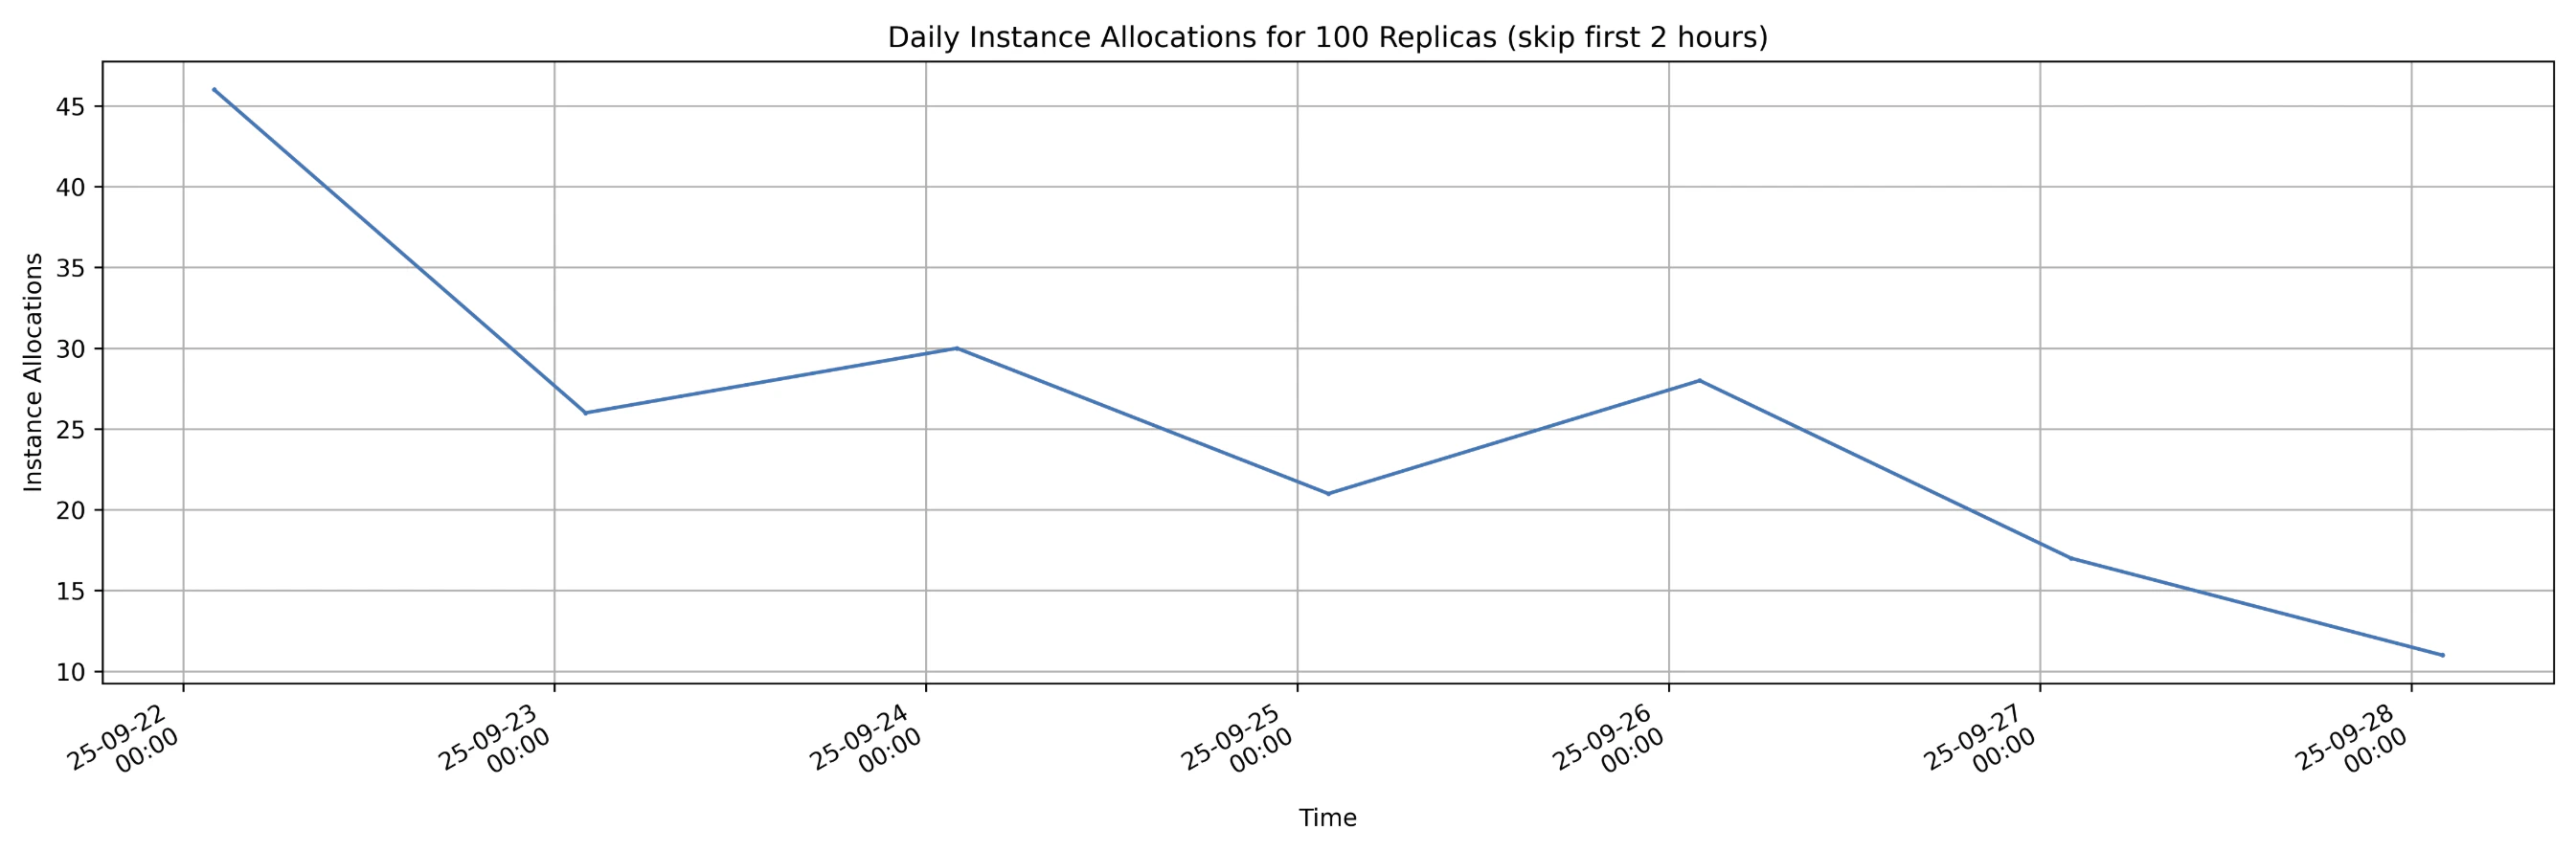 Key observations are:
* Maximum hourly reallocations: `6`
* Average hourly reallocations: `1.1 ( 182 reallocations over 168 hours )`
* Reallocations decreased over time, dropping from more than `45 per day` to fewer than `15 per day`, with some
fluctuations along the way. **This trend shows that as applications run stably for longer periods on nodes, the
likelihood of interruption by node owners decreases.**
## Uptimes
Additionally, the 2025 test measured the uptime distributions of instances over the same period, which are primarily
influenced by startup times and interruptions. The results show that:
Key observations are:
* Maximum hourly reallocations: `6`
* Average hourly reallocations: `1.1 ( 182 reallocations over 168 hours )`
* Reallocations decreased over time, dropping from more than `45 per day` to fewer than `15 per day`, with some
fluctuations along the way. **This trend shows that as applications run stably for longer periods on nodes, the
likelihood of interruption by node owners decreases.**
## Uptimes
Additionally, the 2025 test measured the uptime distributions of instances over the same period, which are primarily
influenced by startup times and interruptions. The results show that:
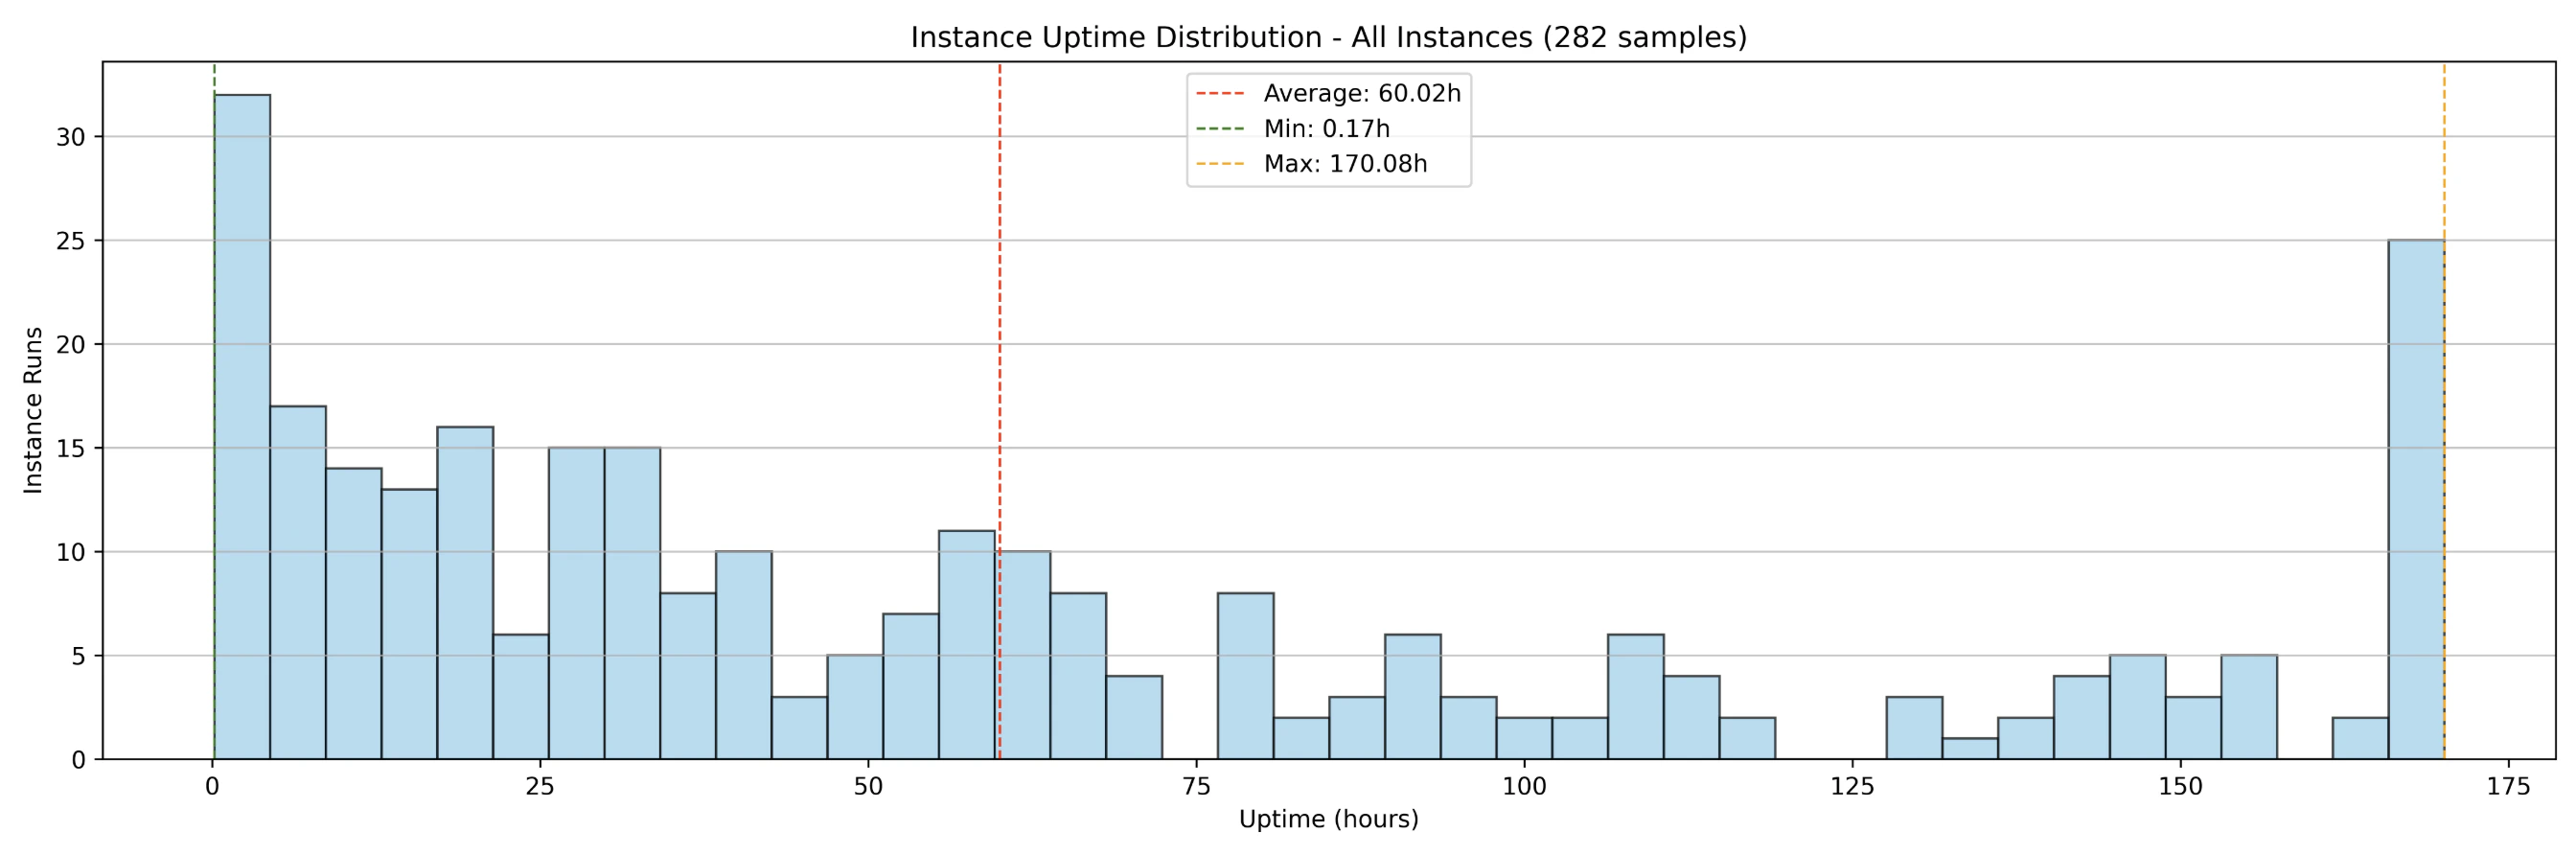
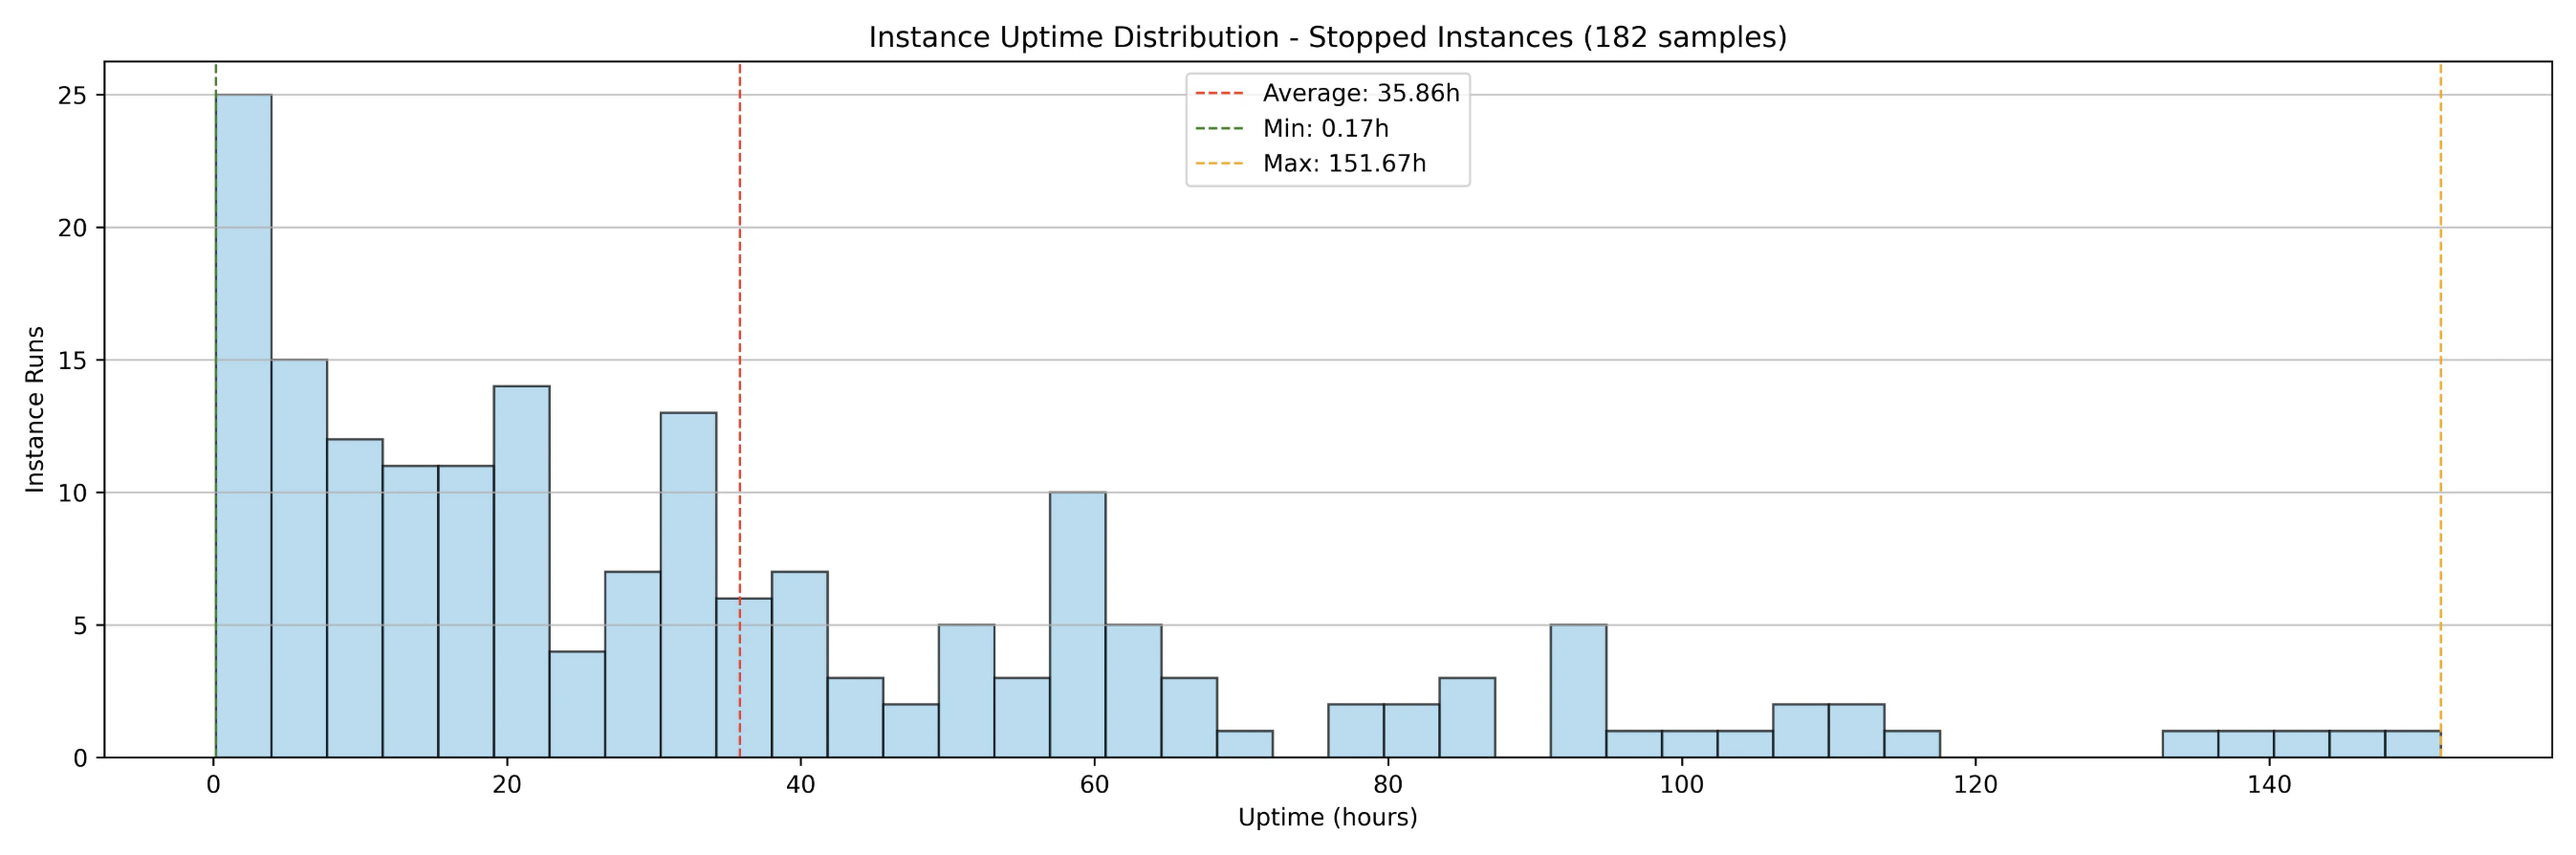 Key observations are:
* 100 instances running over 7 days generated `282 samples` (instance runs).
* Before the container group was shut down, `182` instance runs had already completed (interrupted) while `100`
instances were still running.
* `25` instances ran uninterrupted for full 7-day period.
* The average uptime across all instance runs (interrupted and uninterrupted) was `60 hours`.
* The average uptime of interrupted instance runs was `35 hours`.
## Run-to-Request Ratio
The instance run-to-request ratio measures the actual compute capacity available compared to what is requested. For
example, if 100 instances are requested and 99 are running, the run-to-request ratio is 99%. When a node goes offline
and a replacement is allocated, additional time is required to download and decompress the image before the new instance
becomes operational. Because of variations in startup times and uptimes, a 100% run-to-request ratio cannot be
consistently guaranteed on SaladCloud’s GPU nodes.
Large image sizes can increase startup times, which in turn lowers the run-to-request ratio. To mitigate this, it is
often necessary to provision additional instances (5\~10%) beyond the initial plan, particularly for real-time inference
workloads.
Results from the 2025 test show the instance run-to-request ratio over the 7-day period:
Key observations are:
* 100 instances running over 7 days generated `282 samples` (instance runs).
* Before the container group was shut down, `182` instance runs had already completed (interrupted) while `100`
instances were still running.
* `25` instances ran uninterrupted for full 7-day period.
* The average uptime across all instance runs (interrupted and uninterrupted) was `60 hours`.
* The average uptime of interrupted instance runs was `35 hours`.
## Run-to-Request Ratio
The instance run-to-request ratio measures the actual compute capacity available compared to what is requested. For
example, if 100 instances are requested and 99 are running, the run-to-request ratio is 99%. When a node goes offline
and a replacement is allocated, additional time is required to download and decompress the image before the new instance
becomes operational. Because of variations in startup times and uptimes, a 100% run-to-request ratio cannot be
consistently guaranteed on SaladCloud’s GPU nodes.
Large image sizes can increase startup times, which in turn lowers the run-to-request ratio. To mitigate this, it is
often necessary to provision additional instances (5\~10%) beyond the initial plan, particularly for real-time inference
workloads.
Results from the 2025 test show the instance run-to-request ratio over the 7-day period:
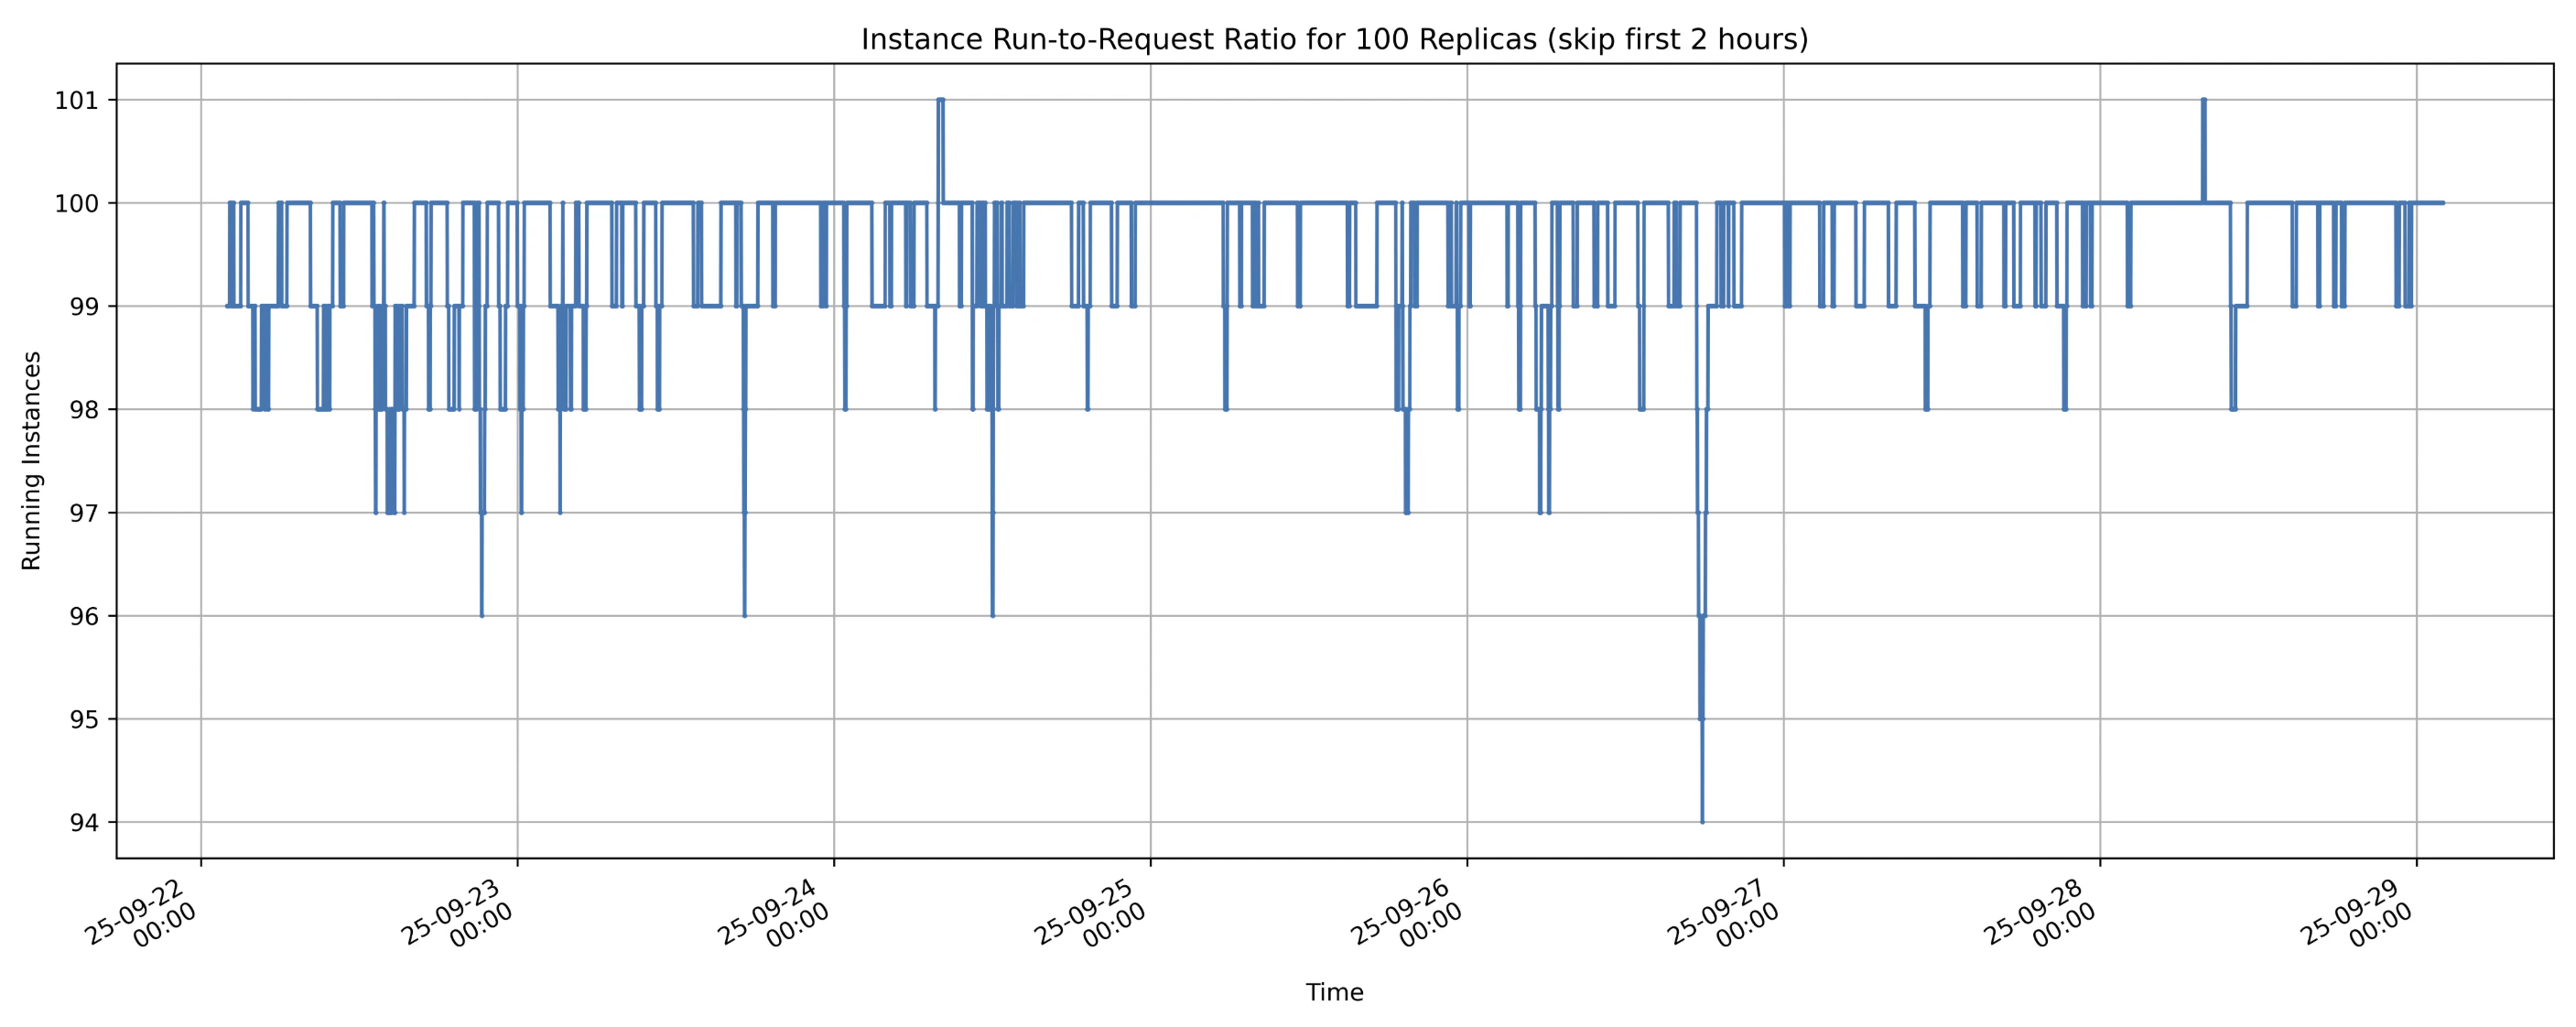 Key observations are:
* Lowest instance run-to-request ratio: `94%`
* Average instance run-to-request ratio: `more than 99%`
* The instance run-to-request ratio can `temporarily exceed 100%` from the application’s perspective. When nodes lose
connection to SaladCloud (not charged in this case), applications may continue running briefly before the nodes are
fully shut down. During this overlap, as new nodes are allocated and start running, the number of active instances can
temporarily exceed the original request.
## Processing Performance
Nodes with the same consumer GPU type can exhibit different performance due to factors such as system configuration
(CPU, RAM), clock speed, cooling, and power limits. Even for the same node, performance may fluctuate over time because
of temperature changes and cooling efficiency.
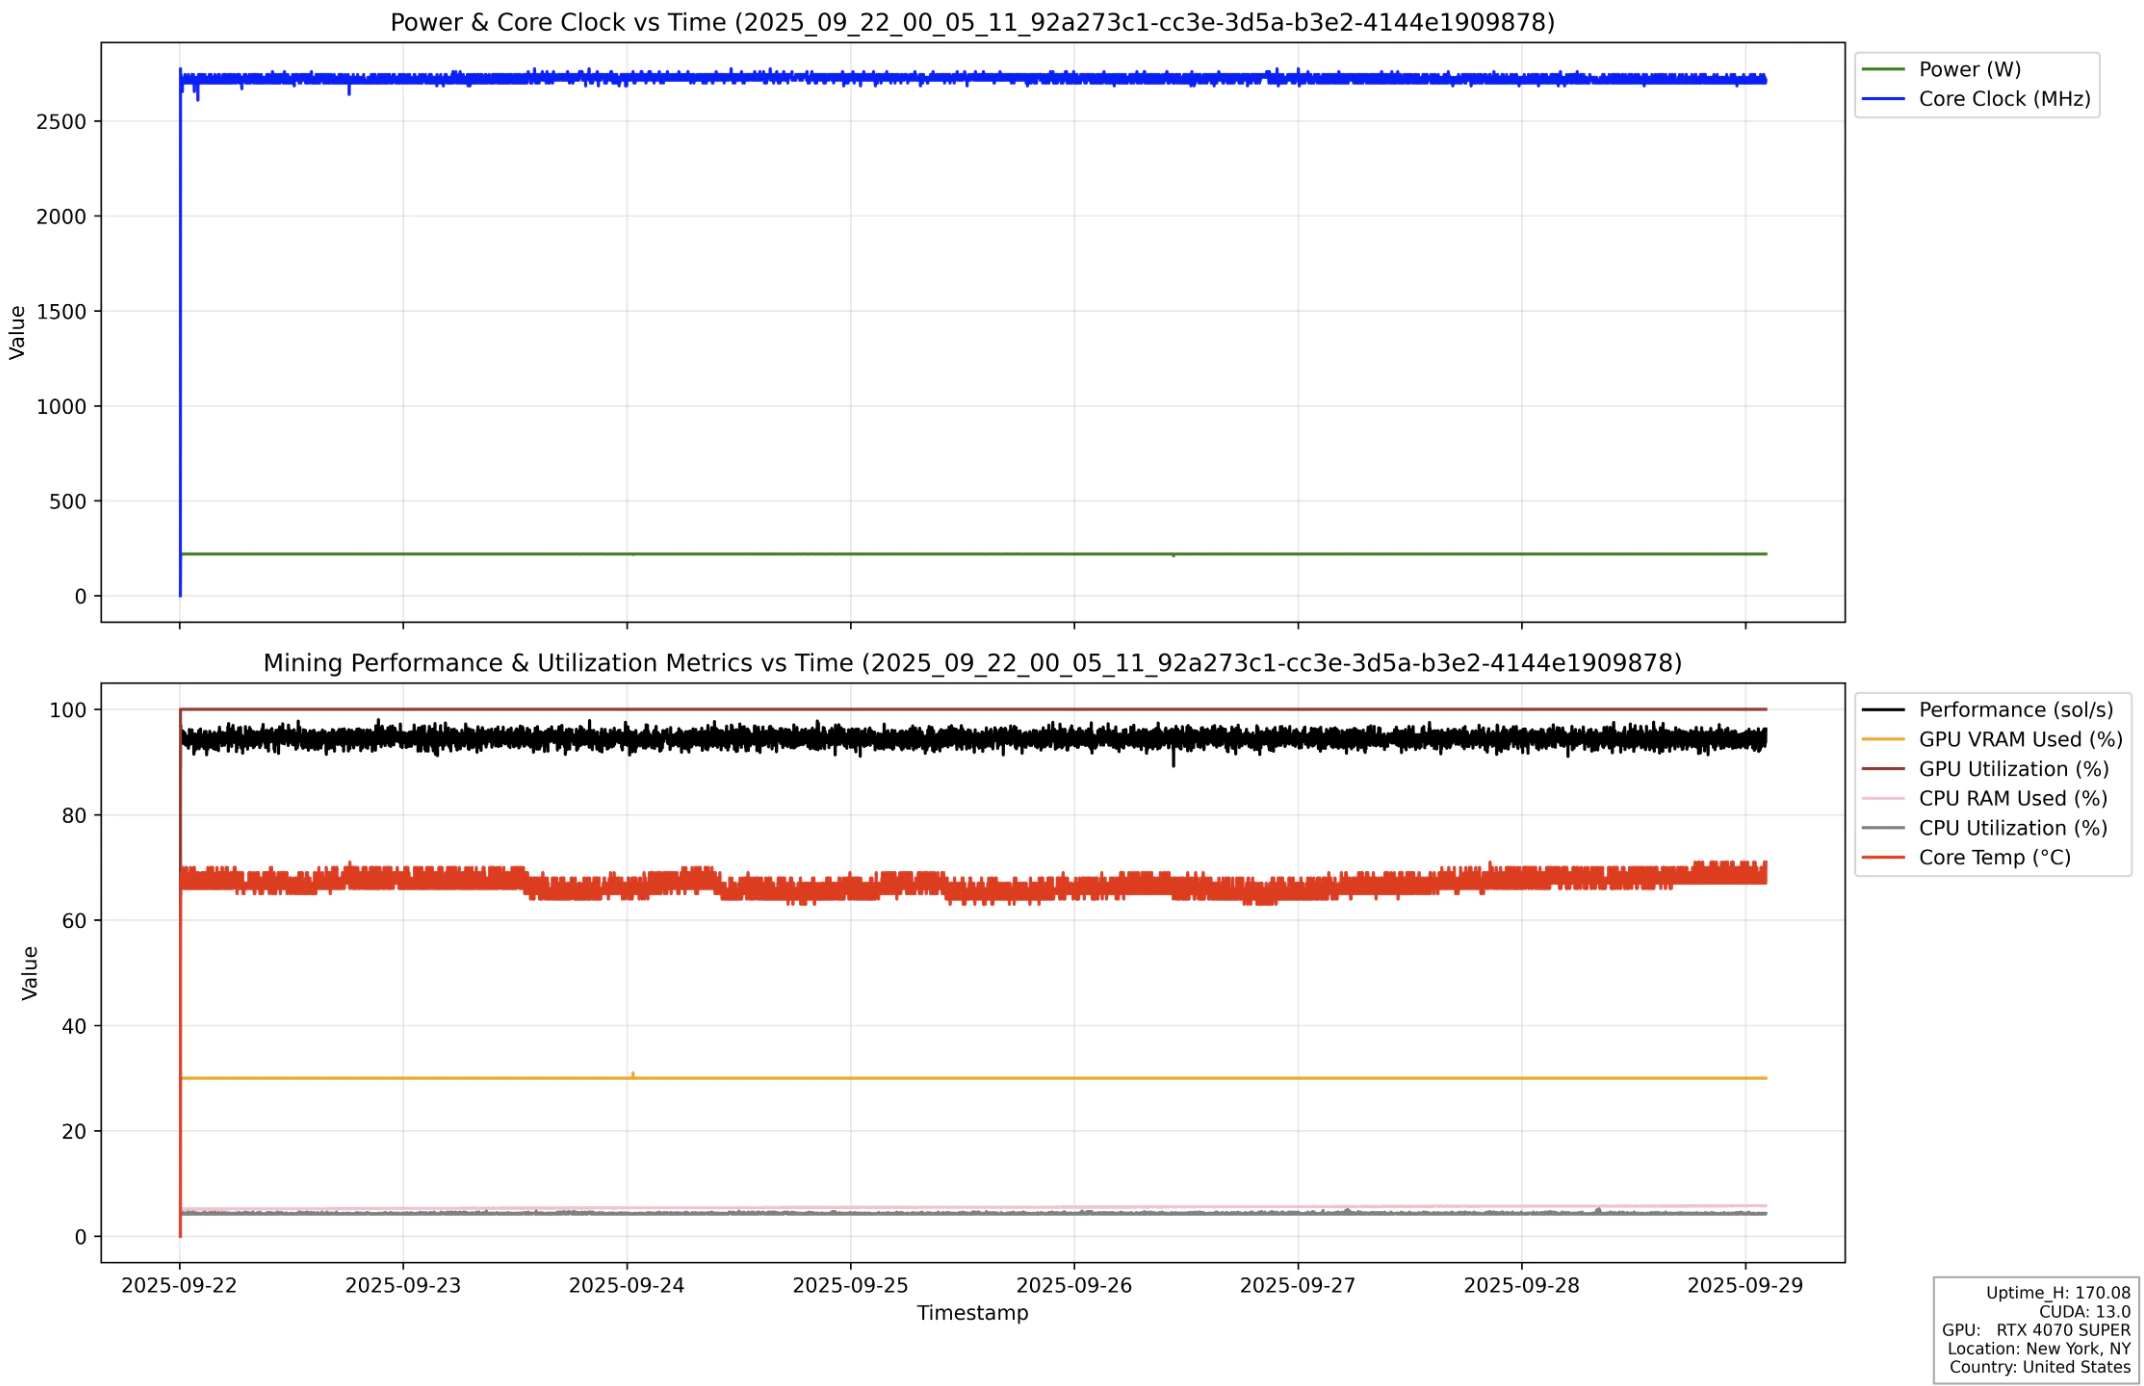
Based on our tests, over 90% of SaladCloud’s consumer GPU nodes provide stable and consistent performance. Here is an
instance run from the 2025 test, illustrating stable performance (black line) and resource usage over the 7-day
execution period.
Key observations are:
* Lowest instance run-to-request ratio: `94%`
* Average instance run-to-request ratio: `more than 99%`
* The instance run-to-request ratio can `temporarily exceed 100%` from the application’s perspective. When nodes lose
connection to SaladCloud (not charged in this case), applications may continue running briefly before the nodes are
fully shut down. During this overlap, as new nodes are allocated and start running, the number of active instances can
temporarily exceed the original request.
## Processing Performance
Nodes with the same consumer GPU type can exhibit different performance due to factors such as system configuration
(CPU, RAM), clock speed, cooling, and power limits. Even for the same node, performance may fluctuate over time because
of temperature changes and cooling efficiency.
Based on our tests, over 90% of SaladCloud’s consumer GPU nodes provide stable and consistent performance. Here is an
instance run from the 2025 test, illustrating stable performance (black line) and resource usage over the 7-day
execution period.
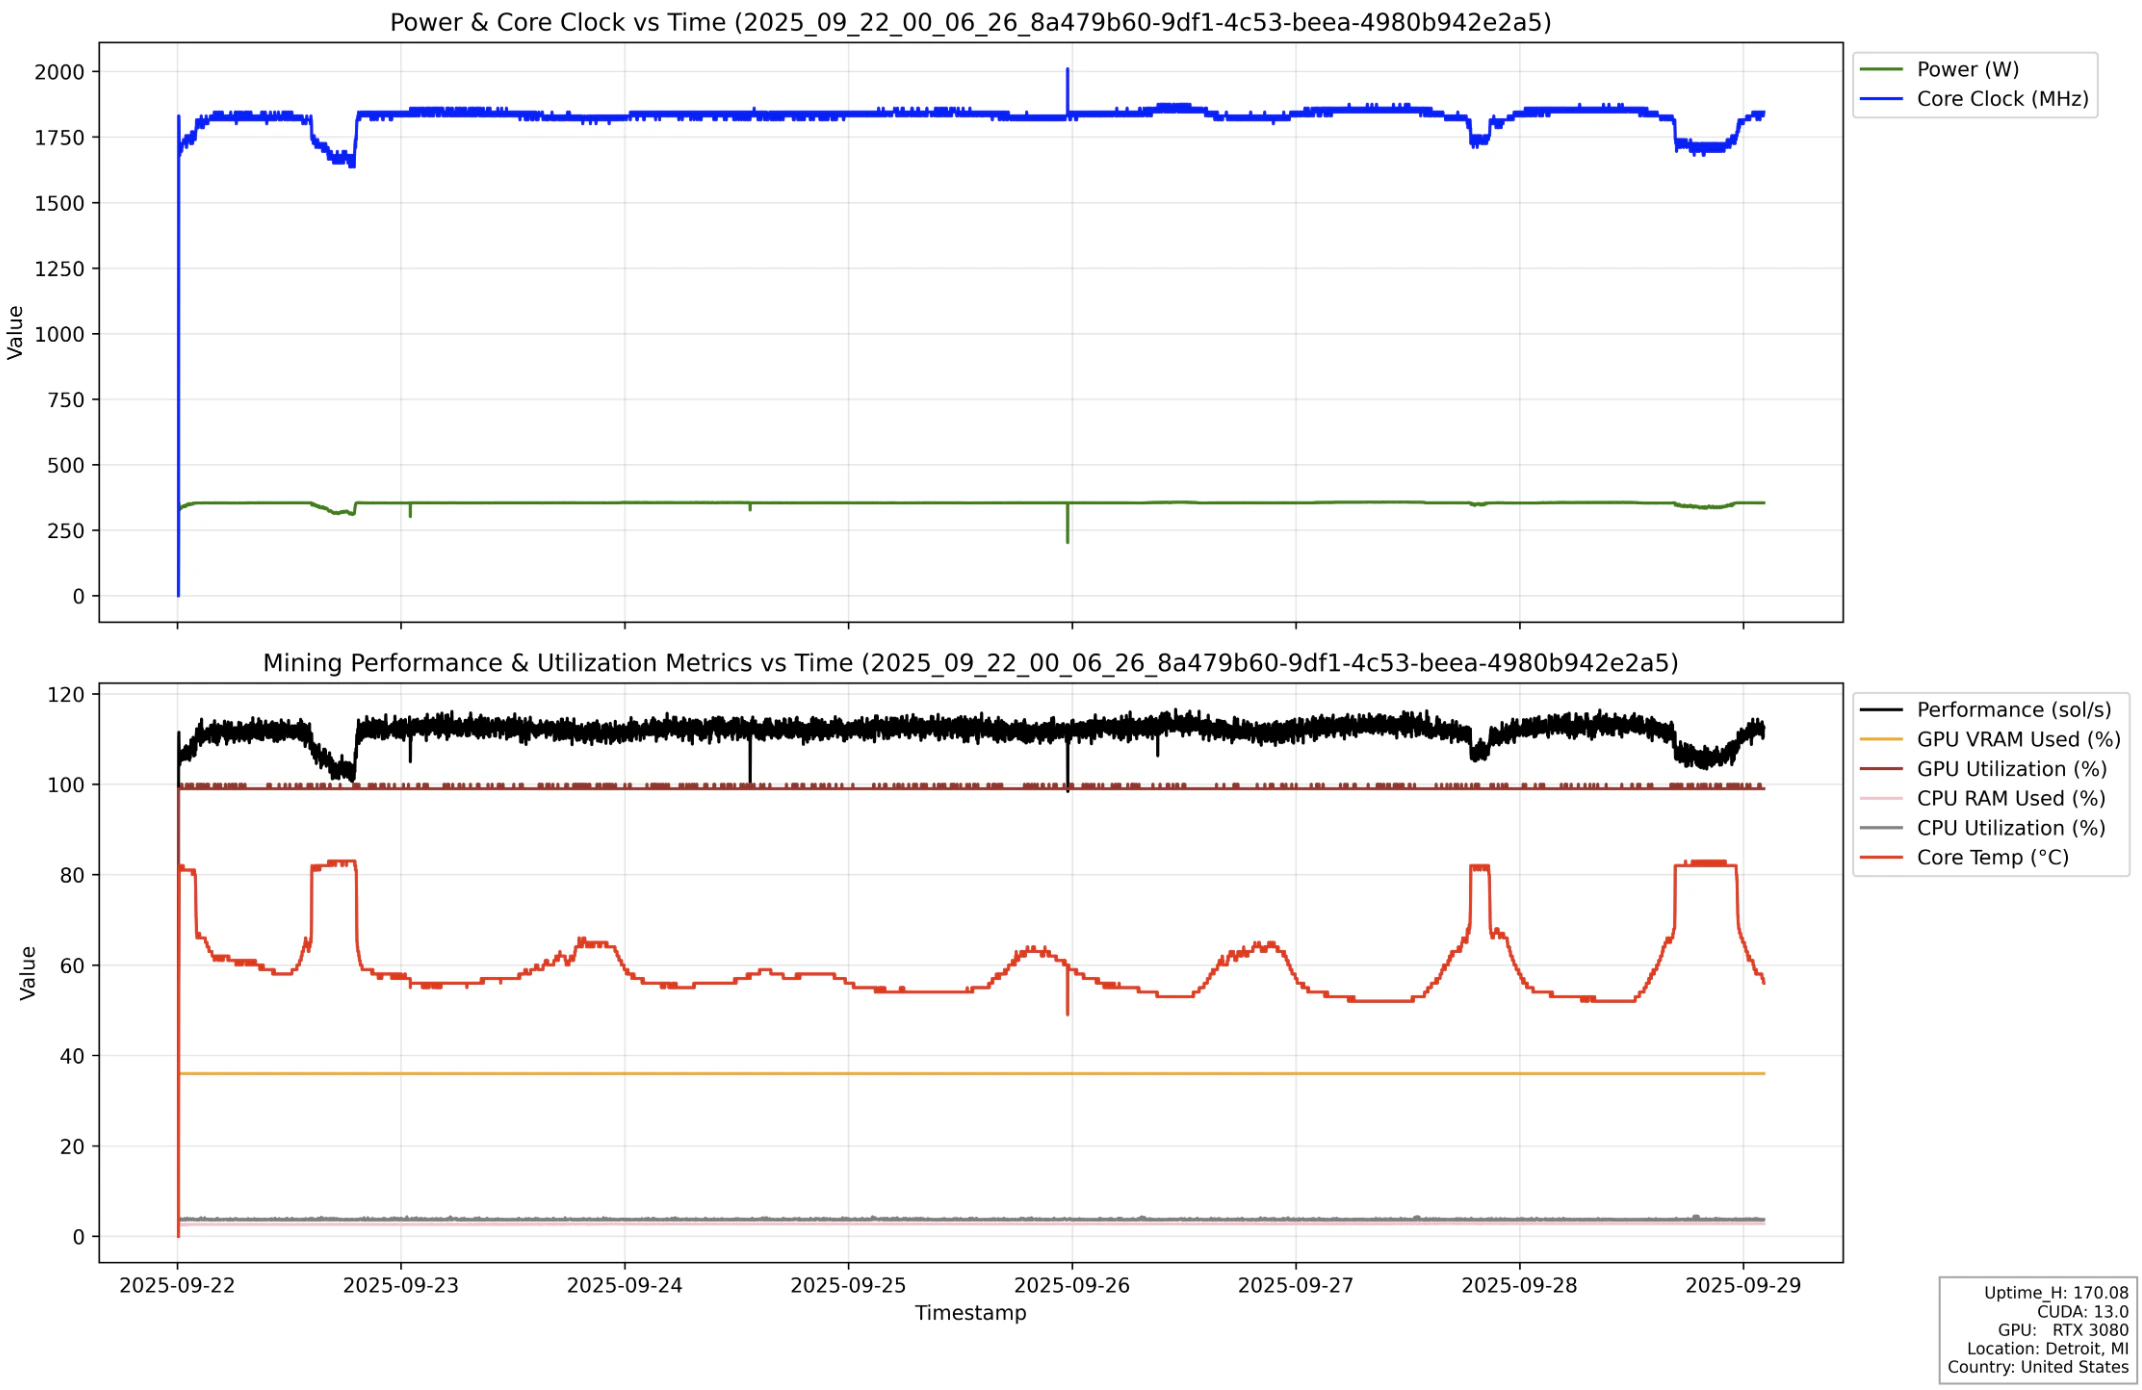
 Another instance run from the same test highlights performance fluctuations due to temperature changes: as GPU
temperatures increased, performance declined.
Another instance run from the same test highlights performance fluctuations due to temperature changes: as GPU
temperatures increased, performance declined.
 To manage performance variances and fluctuations from a small number of consumer GPU nodes, we recommend conducting an
initial check and real-time performance monitoring to select suitable nodes and ensure they remain in an optimal state
for application execution. For more details, please refer to
[this guide](/container-engine/tutorials/performance/high-performance-apps#build-high-performance-applications).
## Network Performance
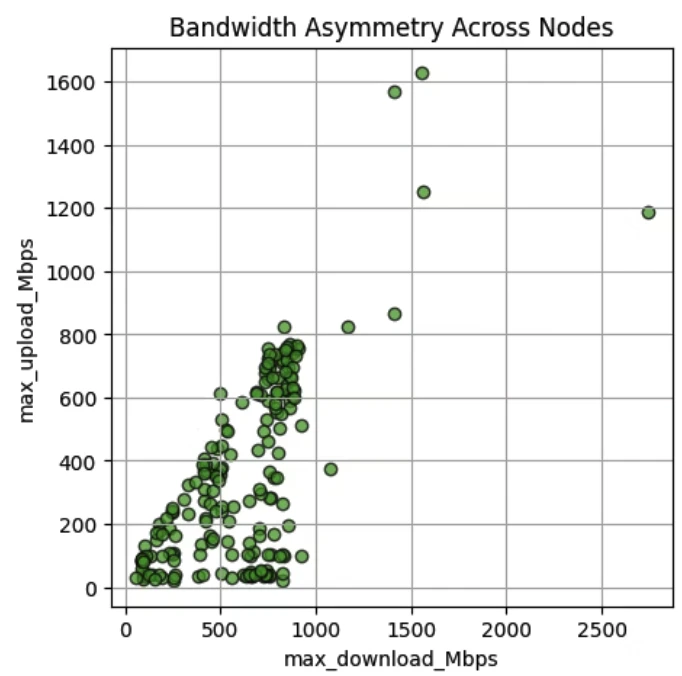
Salad nodes with consumer GPUs often exhibit asymmetric bandwidth, as many operate on residential networks with high
download speeds—frequently hundreds of Mbps—but lower upload speeds, sometimes only tens of Mbps.
The 2025 test results, based on over 200 consumer GPU nodes performing upload and download tasks, reveal significant
speed variance and bandwidth asymmetry. Nevertheless, a substantial number of nodes still provide symmetric bandwidth
and strong overall performance.
To manage performance variances and fluctuations from a small number of consumer GPU nodes, we recommend conducting an
initial check and real-time performance monitoring to select suitable nodes and ensure they remain in an optimal state
for application execution. For more details, please refer to
[this guide](/container-engine/tutorials/performance/high-performance-apps#build-high-performance-applications).
## Network Performance
Salad nodes with consumer GPUs often exhibit asymmetric bandwidth, as many operate on residential networks with high
download speeds—frequently hundreds of Mbps—but lower upload speeds, sometimes only tens of Mbps.
The 2025 test results, based on over 200 consumer GPU nodes performing upload and download tasks, reveal significant
speed variance and bandwidth asymmetry. Nevertheless, a substantial number of nodes still provide symmetric bandwidth
and strong overall performance.
 Round-trip time (RTT) is primarily determined by the geographical distance and underlying network latency between two
endpoints, and it plays a critical role in data transfer throughput. Since Salad nodes are globally distributed, nodes
with identical network speeds in different regions can exhibit varying throughput to a specific endpoint, such as a
cloud storage bucket in a particular location. Transfer tools and algorithms also matter—using chunked and parallel data
transfers can better utilize the available end-to-end bandwidth.
If your applications require higher throughput with lower latency, perform startup checks from inside the container and
request reallocation only when a node does not meet a real workload requirement. SaladCloud does not provide a container
group setting or node filter for minimum network bandwidth. Please check
[this guide](/container-engine/tutorials/performance/network-bandwidth-checks) for more information.
Round-trip time (RTT) is primarily determined by the geographical distance and underlying network latency between two
endpoints, and it plays a critical role in data transfer throughput. Since Salad nodes are globally distributed, nodes
with identical network speeds in different regions can exhibit varying throughput to a specific endpoint, such as a
cloud storage bucket in a particular location. Transfer tools and algorithms also matter—using chunked and parallel data
transfers can better utilize the available end-to-end bandwidth.
If your applications require higher throughput with lower latency, perform startup checks from inside the container and
request reallocation only when a node does not meet a real workload requirement. SaladCloud does not provide a container
group setting or node filter for minimum network bandwidth. Please check
[this guide](/container-engine/tutorials/performance/network-bandwidth-checks) for more information.