> ## Documentation Index
> Fetch the complete documentation index at: https://docs.salad.com/llms.txt
> Use this file to discover all available pages before exploring further.
# Container Logs
*Last Updated: January 6, 2026*
## How to Log From Your Container
When running a container on SaladCloud, you can log to the standard output and standard error streams. These logs are
collected and stored by SaladCloud, and exported to any configured
[external logging source](/container-engine/explanation/infrastructure-platform/external-logging).
[Learn more about logging best practices.](/container-engine/how-to-guides/external-logging/best-practices)
## Basic Logging
### How to View Container Logs In the Portal
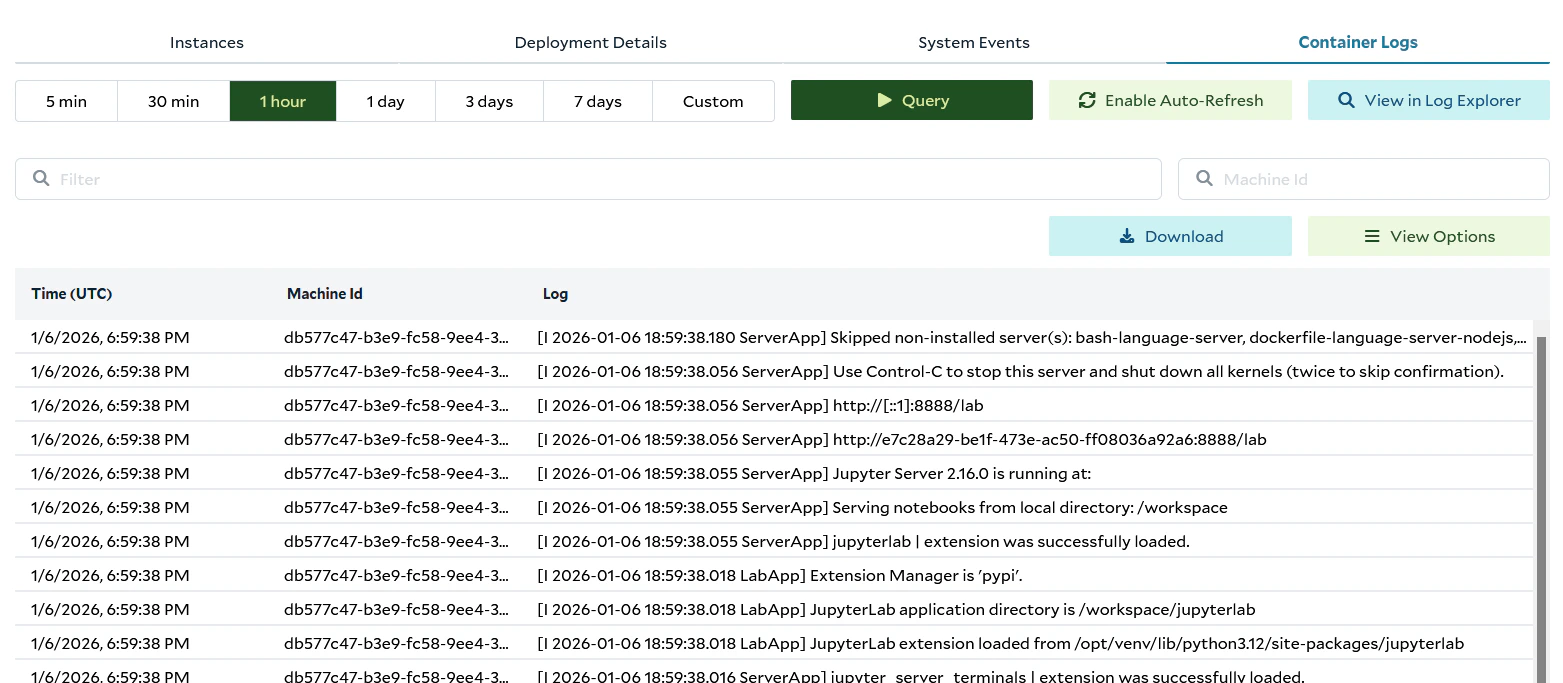
Once your container is up and running on a SaladCloud node, you can view the logs from your container on the "Container
Logs" tab of a Container Group. To access this feature in the portal, navigate to your Container Group details page, and
click on the 'Container Logs' tab.
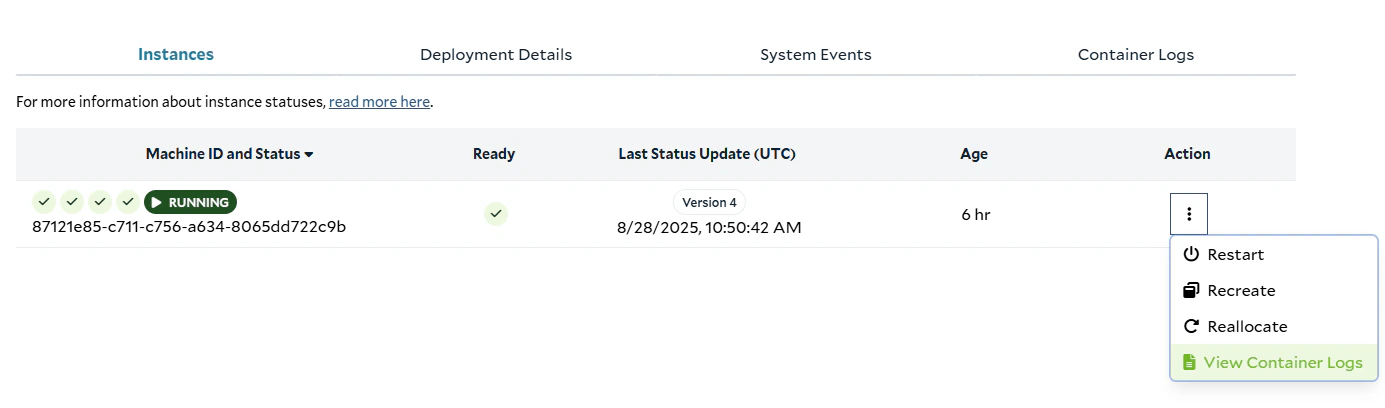
 You can also navigate to this page from the Action menu of an instance. This option will take you to the Container Logs
tab with the Machine ID value pre-filled.
You can also navigate to this page from the Action menu of an instance. This option will take you to the Container Logs
tab with the Machine ID value pre-filled.
 The Container Logs feature has a simple interface meant to provide you with enough visibility for basic troubleshooting
of your applications running on SaladCloud. For more robust logging functionality, we recommend configuring the
[External Logging Service option](/container-engine/explanation/infrastructure-platform/external-logging) in your
container group.
The Container Logs feature allows you to query your container logs with these options:
* search for specific log messages with case-insensitive string filtering
* filter for logs from a specific Machine ID. If left blank, logs from all Machine IDs in the Container Group will be
returned.
* filter for logs in a specified time period. Choose one of the predefined options, or use the custom start date and end
date option
When your query returns results you will see them in a scrollable table view. Each result includes:
* Log Message
* Machine ID (The unique ID of the node running the container that created the log message.)
* Log Create Time
Should your query yield no results, the table view will display "No data to display"
For more sophisticated querying, you can use the Log Explorer or the Public API
[Query Log Entries endpoint](/reference/saladcloud-api/logs/query-log-entries). Clicking the Log Explorer button will
take you to the Log Explorer page in the SaladCloud Portal with the current query pre-populated.
**Availability and Limitations**
* A maximum of 500 logs can be returned per query. Utilize specific query filters and time ranges to get the logs you
are looking for.
* Logs are retained and accessible for up to 90 days.
* If you encounter this error message, try narrowing your query's time range
*
The Container Logs feature has a simple interface meant to provide you with enough visibility for basic troubleshooting
of your applications running on SaladCloud. For more robust logging functionality, we recommend configuring the
[External Logging Service option](/container-engine/explanation/infrastructure-platform/external-logging) in your
container group.
The Container Logs feature allows you to query your container logs with these options:
* search for specific log messages with case-insensitive string filtering
* filter for logs from a specific Machine ID. If left blank, logs from all Machine IDs in the Container Group will be
returned.
* filter for logs in a specified time period. Choose one of the predefined options, or use the custom start date and end
date option
When your query returns results you will see them in a scrollable table view. Each result includes:
* Log Message
* Machine ID (The unique ID of the node running the container that created the log message.)
* Log Create Time
Should your query yield no results, the table view will display "No data to display"
For more sophisticated querying, you can use the Log Explorer or the Public API
[Query Log Entries endpoint](/reference/saladcloud-api/logs/query-log-entries). Clicking the Log Explorer button will
take you to the Log Explorer page in the SaladCloud Portal with the current query pre-populated.
**Availability and Limitations**
* A maximum of 500 logs can be returned per query. Utilize specific query filters and time ranges to get the logs you
are looking for.
* Logs are retained and accessible for up to 90 days.
* If you encounter this error message, try narrowing your query's time range
*  ## Advanced Logging
For more advanced on-platform logging capabilities, you can make use of the
[Query Log Entries endpoint](/reference/saladcloud-api/logs/query-log-entries) in the API. This endpoint is scoped at
the organization level, rather than the container group level, allowing you to view logs from any number of container
groups and projects.
This endpoint supports a more flexible query language as well, allowing you to make much more sophisticated filters
across many fields, and supporting filters on structured logs emitted by your application.
[See the full query reference](/container-engine/reference/log-queries).
You can query logs by making a POST request to the query logs endpoint like this:
```shell theme={null}
curl --request POST \
--url https://api.salad.com/api/public/organizations/$organization_name/log-entries \
--header 'Content-Type: application/json' \
--header "Salad-Api-Key: $salad_api_key" \
--data '{
"end_time": "2025-11-07T05:31:56Z",
"page_size": 1,
"query": "",
"sort_order": "desc",
"start_time": "2025-11-07T05:31:56Z"
}'
```
and receive a response like:
```json theme={null}
{
"items": [
{
"json_log": {},
"parent_span_id": "",
"receive_time": "2025-11-07T05:31:56Z",
"resource": {
"labels": {},
"type": ""
},
"severity": "debug",
"span_Id": "",
"time": "2025-11-07T05:31:56Z",
"trace_Id": ""
}
],
"organization_name": "acme-corp",
"page_max_time": "2025-11-07T05:31:56Z",
"page_min_time": "2025-11-07T05:31:56Z"
}
```
Each log event takes the following structure.
```json theme={null}
{
"time": "string iso8601",
"receive_time": "string iso8601",
"resource": {
"type": "string enum",
"labels": {
// key-value pairs (string to string) specific to `type`
}
},
"severity": "string enum",
"severity_number": "integer",
"trace_id": "string", // optional
"span_id": "string", // optional
"parent_span_id": "string", //optional
// only one of `text_log` or `json_log`
"text_log": "string",
"json_log": {
// key-value pairs (string to any valid JSON type) specific to log entry
}
}
```
* Note that this will contain **EITHER** `text_log` **OR** `json_log`, but not both. If you emit logs that are valid
json, they will end up in the `json_log` field. Otherwise, the full log line will be in the `text_log` field.
* The `time` field indicates the system time on the node where the log was emitted.
* the `receive_time` field indicates the time when Axiom (what we use under the hood for log storage) received the log
entry.
* Any of these fields can be used in the query language.
[Here](https://docs.salad.com/container-engine/reference/log-queries#examples) are some examples of queries you can
make. These queries can be passed as the `query` parameter in the body of the request to the API.
## Advanced Logging
For more advanced on-platform logging capabilities, you can make use of the
[Query Log Entries endpoint](/reference/saladcloud-api/logs/query-log-entries) in the API. This endpoint is scoped at
the organization level, rather than the container group level, allowing you to view logs from any number of container
groups and projects.
This endpoint supports a more flexible query language as well, allowing you to make much more sophisticated filters
across many fields, and supporting filters on structured logs emitted by your application.
[See the full query reference](/container-engine/reference/log-queries).
You can query logs by making a POST request to the query logs endpoint like this:
```shell theme={null}
curl --request POST \
--url https://api.salad.com/api/public/organizations/$organization_name/log-entries \
--header 'Content-Type: application/json' \
--header "Salad-Api-Key: $salad_api_key" \
--data '{
"end_time": "2025-11-07T05:31:56Z",
"page_size": 1,
"query": "",
"sort_order": "desc",
"start_time": "2025-11-07T05:31:56Z"
}'
```
and receive a response like:
```json theme={null}
{
"items": [
{
"json_log": {},
"parent_span_id": "",
"receive_time": "2025-11-07T05:31:56Z",
"resource": {
"labels": {},
"type": ""
},
"severity": "debug",
"span_Id": "",
"time": "2025-11-07T05:31:56Z",
"trace_Id": ""
}
],
"organization_name": "acme-corp",
"page_max_time": "2025-11-07T05:31:56Z",
"page_min_time": "2025-11-07T05:31:56Z"
}
```
Each log event takes the following structure.
```json theme={null}
{
"time": "string iso8601",
"receive_time": "string iso8601",
"resource": {
"type": "string enum",
"labels": {
// key-value pairs (string to string) specific to `type`
}
},
"severity": "string enum",
"severity_number": "integer",
"trace_id": "string", // optional
"span_id": "string", // optional
"parent_span_id": "string", //optional
// only one of `text_log` or `json_log`
"text_log": "string",
"json_log": {
// key-value pairs (string to any valid JSON type) specific to log entry
}
}
```
* Note that this will contain **EITHER** `text_log` **OR** `json_log`, but not both. If you emit logs that are valid
json, they will end up in the `json_log` field. Otherwise, the full log line will be in the `text_log` field.
* The `time` field indicates the system time on the node where the log was emitted.
* the `receive_time` field indicates the time when Axiom (what we use under the hood for log storage) received the log
entry.
* Any of these fields can be used in the query language.
[Here](https://docs.salad.com/container-engine/reference/log-queries#examples) are some examples of queries you can
make. These queries can be passed as the `query` parameter in the body of the request to the API.